Running Tests and Coverage
This page covers how to use e Builder (Debug) to run the tests prepared in a project from the VSCode UI and check the results and coverage.
Tests run on your PC. Neither a connection to the server nor the debug settings in Server-Side Setup are needed.
This page covers how to run tests from VSCode. It does not cover how to write test code.
Writing Tests with a Jest-Compatible API
You can write test code in the same style as Jest, a widely used JavaScript testing framework. Defining tests with describe / it / expect, lifecycle functions such as beforeEach / afterEach, and mocks with jest.fn() / jest.spyOn() are all available.
If you have used Jest, you can start writing right away, and when you have an AI agent generate test code, the usual Jest style works as is.
For details on each API, see the official Jest documentation at https://jestjs.io/docs/api.
Tests run on the same JavaScript engine as server-side scripts (Rhino). As a result, the following features are unavailable.
| Unavailable | Use instead |
|---|---|
async / await, Promises (.resolves / .rejects) | The done callback |
require() | load() |
Snapshot testing (toMatchSnapshot()) | toEqual() |
Prerequisites
- The JDK is available (if you have finished installing Java (JDK) in Prerequisites and Required Tools, no additional setup is needed)
- You have opened the project in VSCode and completed Trusting the Folder
- The project has
pom.xmlandsrc/test/jssp - Test code is present under
src/test/jssp
1. Prepare the Configuration File
To show the test list, a Jest configuration file is required in the project root. A project without a configuration file does not appear in the test list.
Only the test feature needs a configuration file. Debugging Scripts works without one.
Steps
-
Create a file named
jest.config.jsin the project root (the same level aspom.xml).<project root>/├── pom.xml├── jest.config.js <- Create it here└── src/├── main/jssp/...└── test/jssp/... -
Write the following content and save it. If you have the standard structure of a project created with Accel CLI, you can use this content as is.
jest.config.jsmodule.exports = {testMatch: ["src/test/jssp/**/*.test.js"],sourcePathMapping: {"src/test/jssp/src/": "src/main/jssp/src/",},}; -
A notification prompts you to reload because the Jest configuration changed. Select "Reload Window".
What the Configuration Means
| Field | Description |
|---|---|
testMatch | The file name patterns treated as test files. Files matching these appear in the list |
sourcePathMapping | The mapping between test code and source code. The source files under test are loaded automatically |
In the example above, .test.js files under src/test/jssp are treated as tests, and the source code in src/main/jssp/src/ corresponding to the test code in src/test/jssp/src/ is loaded.
You confirm whether the configuration file was read correctly by opening the test list in 2. Run the Tests below.
Configuration files are searched for in the following order, and only the first one found is read.
jest.config.jsjest.config.json- The
jestkey inpackage.json
Even if you prepare several, the second and later ones are not read.
Write jest.config.js in the form module.exports = { ... }.
The function form (module.exports = () => ({ ... })) causes an error. You also cannot use require() inside the configuration file.
The configuration file is read once, when VSCode starts. When you change it, a notification prompts you to reload, so select "Reload Window".
2. Run the Tests
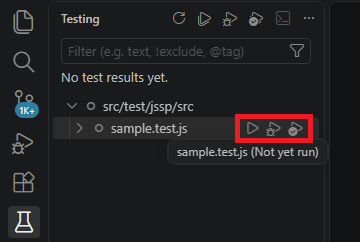
- Open Testing (the flask icon) in the Activity Bar.
- A test list appears for each project.
- Hovering over the item you want to run shows three icons on the right. Click the one you want.
Testing is a view built into VSCode. However, when no extension provides tests, the icon itself does not appear.
Check the following in order.
- There is a Jest configuration file in the project root (1. Prepare the Configuration File)
- You reloaded the window after creating the configuration file (the configuration is read once, at startup)
- You have trusted the folder (Trusting the Folder)
- The project root has both
pom.xmlandsrc/test/jssp
If it still does not appear, select e Builder (Debug) in the Output panel and check whether an error is reported.
There are three ways to run tests. Hovering over an icon shows its name.
| Icon | Behavior |
|---|---|
| Run Test | Runs the tests |
| Debug Test | Runs them with breakpoints enabled (3. Debug the Tests) |
| Run Test with Coverage | Runs them while collecting coverage (4. Check Coverage) |
The same three are also available from the menu you get by right-clicking an item.
You can run at the level of a folder, a file, a describe, or a single test. You can also run all tests together from the button at the top of the list.
Results are shown with icons. If a test fails, clicking it shows the error details in the editor.
You cannot hold Ctrl to select and run multiple tests. Run them one at a time, or run all of them together.
3. Debug the Tests
You can pause a test partway through and inspect variable values.
- Set a breakpoint on the line where you want to stop.
- In the test list, hover over the item you want to run and click the Debug Test icon.
No connection settings are needed. The e Builder (extensions) connect automatically.
4. Check Coverage
You can see which lines of code the tests executed.
- In the test list, hover over the item you want to run and click the Run Test with Coverage icon.
- After the run, the coverage percentage appears in the test list view.
- When you open a file, executed lines and unexecuted lines are shown in different colors.
Three kinds are totaled: lines, branches, and functions.
Check with the HTML Report
Running with coverage also produces an HTML report you can view in a browser. Open target/coverage/index.html in the project root with a browser.
The report shows the following.
- The coverage percentage for lines, branches, and functions (a summary for the whole project)
- A per-file coverage list
- The executed and unexecuted lines in the source code, shown when you click a file name
Because you can check it without opening VSCode, it is also useful for reviews and for sharing within a team.
To change the output destination, specify coverageDirectory in jest.config.js (the default is target/coverage). You can give a path relative to the project root (for example, coverage), a path starting with <rootDir> (for example, <rootDir>/coverage), or an absolute path. <rootDir> refers to rootDir in jest.config.js, and if you have not specified rootDir, it is the project root.
module.exports = {
  testMatch: ["src/test/jssp/**/*.test.js"],
  sourcePathMapping: {
    "src/test/jssp/src/": "src/main/jssp/src/",
  },
  coverageDirectory: "coverage",
};
In this example, the report is written to coverage/index.html. When you change the configuration, you need to reload the window, just as in 1. Prepare the Configuration File.
Verification
- Tests appear in the test list
- Running a test shows a success or failure icon
If you cannot find Testing (the flask icon), or if no tests appear in the list, see the checks in 2. Run the Tests and Limitations.